Generating diagrams from a SQlite database with Python

There are tools out there that can be used to reverse engineer databases and generate diagrams. These tools normally are GUI based. But I needed one that could be used in a project build to generate a simple diagram for documentation.
A tool in Python would be ideal, as that is the language the project I was working on was written in. After searching in DuckDuckGo and PYPI, I found ERAlchemy that seemed to have the features I needed - kinda.
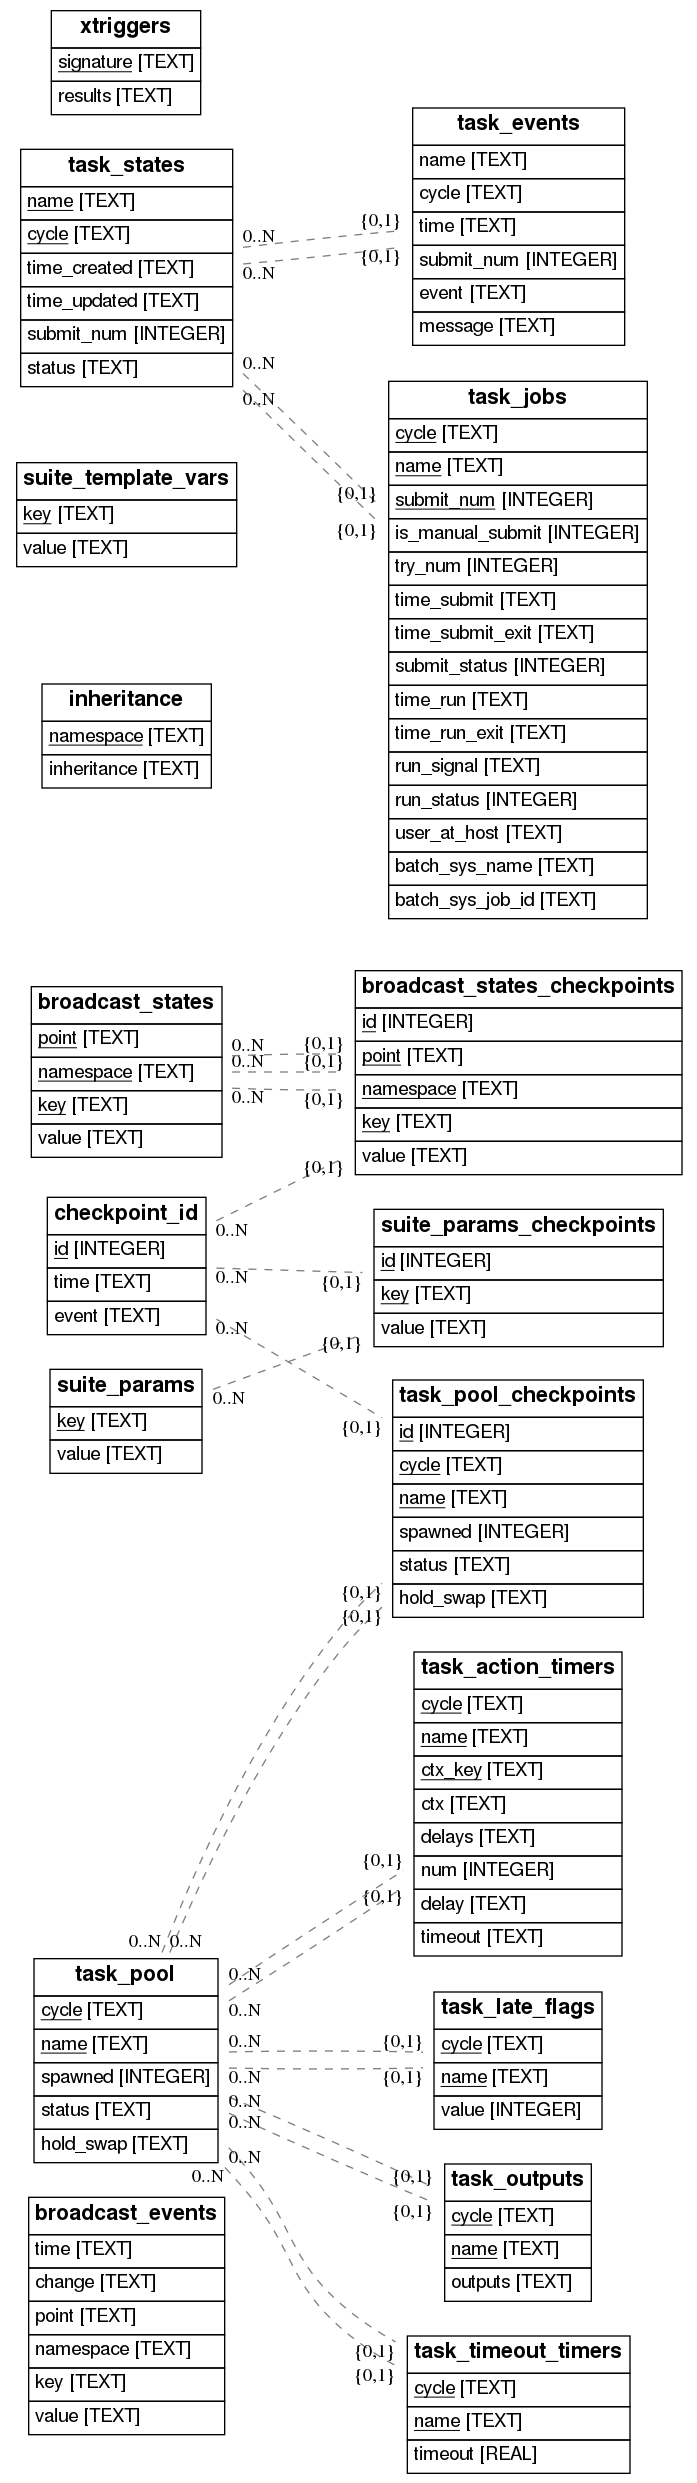
Running the default eralchemy -i sqlite:///relative/path/to/db.db -o erd_from_sqlite.pdf against
the project database, the diagram generated was not really easy to read. It was very tall,
and did not appear to respect any order such as number of relationships, alphabetical order, etc.
Looking at the code, I found where it produced a dot file. So I decided first to have a go at
quickly customizing that file and running dot to produce a better diagram.
# file: custom.dot
graph {
	node [label = "\N", shape = plaintext];
	edge [color = gray50, minlen = 2, style = dashed];
	rankdir = "TB";
	newrank="true"

	"broadcast_events" [label=<<FONT FACE="Helvetica"><TABLE BORDER="0" CELLBORDER="1" CELLPADDING="4" CELLSPACING="0"><TR><TD><B><FONT POINT-SIZE="16">broadcast_events</FONT></B></TD></TR><TR><TD ALIGN="LEFT"><FONT>time</FONT></TD></TR><TR><TD ALIGN="LEFT"><FONT>change</FONT></TD></TR><TR><TD ALIGN="LEFT"><FONT>point</FONT></TD></TR><TR><TD ALIGN="LEFT"><FONT>namespace</FONT></TD></TR><TR><TD ALIGN="LEFT"><FONT>key</FONT></TD></TR><TR><TD ALIGN="LEFT"><FONT>value</FONT></TD></TR></TABLE></FONT>>];
	"broadcast_states" [label=<<FONT FACE="Helvetica"><TABLE BORDER="0" CELLBORDER="1" CELLPADDING="4" CELLSPACING="0"><TR><TD><B><FONT POINT-SIZE="16">broadcast_states</FONT></B></TD></TR><TR><TD ALIGN="LEFT"><u><FONT>point</FONT></u></TD></TR><TR><TD ALIGN="LEFT"><u><FONT>namespace</FONT></u></TD></TR><TR><TD ALIGN="LEFT"><u><FONT>key</FONT></u></TD></TR><TR><TD ALIGN="LEFT"><FONT>value</FONT></TD></TR></TABLE></FONT>>];
	...
	"task_timeout_timers" [label=<<FONT FACE="Helvetica"><TABLE BORDER="0" CELLBORDER="1" CELLPADDING="4" CELLSPACING="0"><TR><TD><B><FONT POINT-SIZE="16">task_timeout_timers</FONT></B></TD></TR><TR><TD ALIGN="LEFT"><u><FONT>cycle</FONT></u></TD></TR><TR><TD ALIGN="LEFT"><u><FONT>name</FONT></u></TD></TR><TR><TD ALIGN="LEFT"><FONT>timeout</FONT></TD></TR></TABLE></FONT>>];
	"xtriggers" [label=<<FONT FACE="Helvetica"><TABLE BORDER="0" CELLBORDER="1" CELLPADDING="4" CELLSPACING="0"><TR><TD><B><FONT POINT-SIZE="16">xtriggers</FONT></B></TD></TR><TR><TD ALIGN="LEFT"><u><FONT>signature</FONT></u></TD></TR><TR><TD ALIGN="LEFT"><FONT>results</FONT></TD></TR></TABLE></FONT>>];
	"task_states" -- "task_events" [taillabel=<<FONT>0..N</FONT>>,headlabel=<<FONT>{0,1}</FONT>>];
	...
	"task_pool" -- "task_timeout_timers" [taillabel=<<FONT>{0,1}</FONT>>,headlabel=<<FONT>{0,1}</FONT>>];
}
That worked initially, producing a horizontal diagram as I wanted.
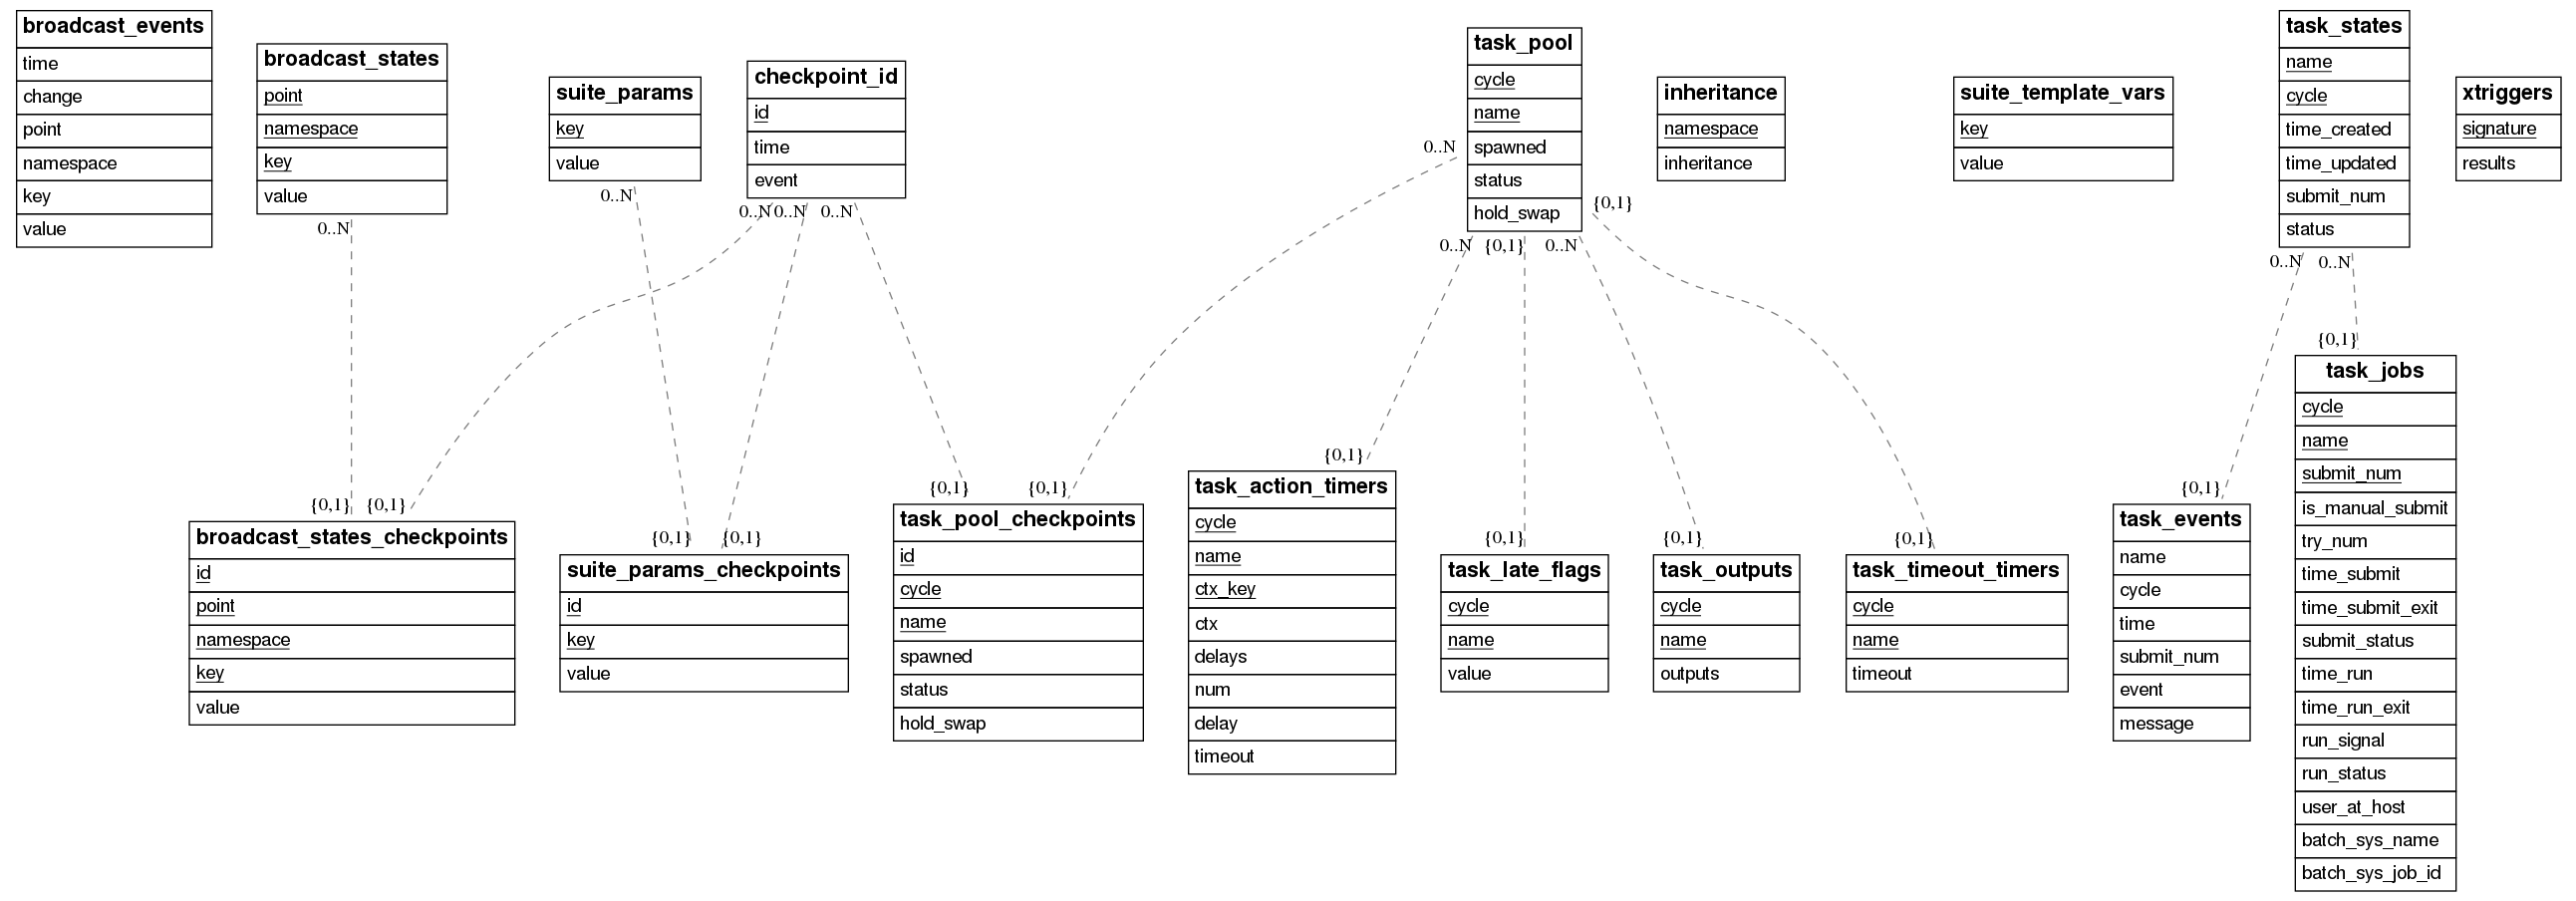
But the utility tables, those without any relationship, were scattered over the diagram, and I wanted them grouped.
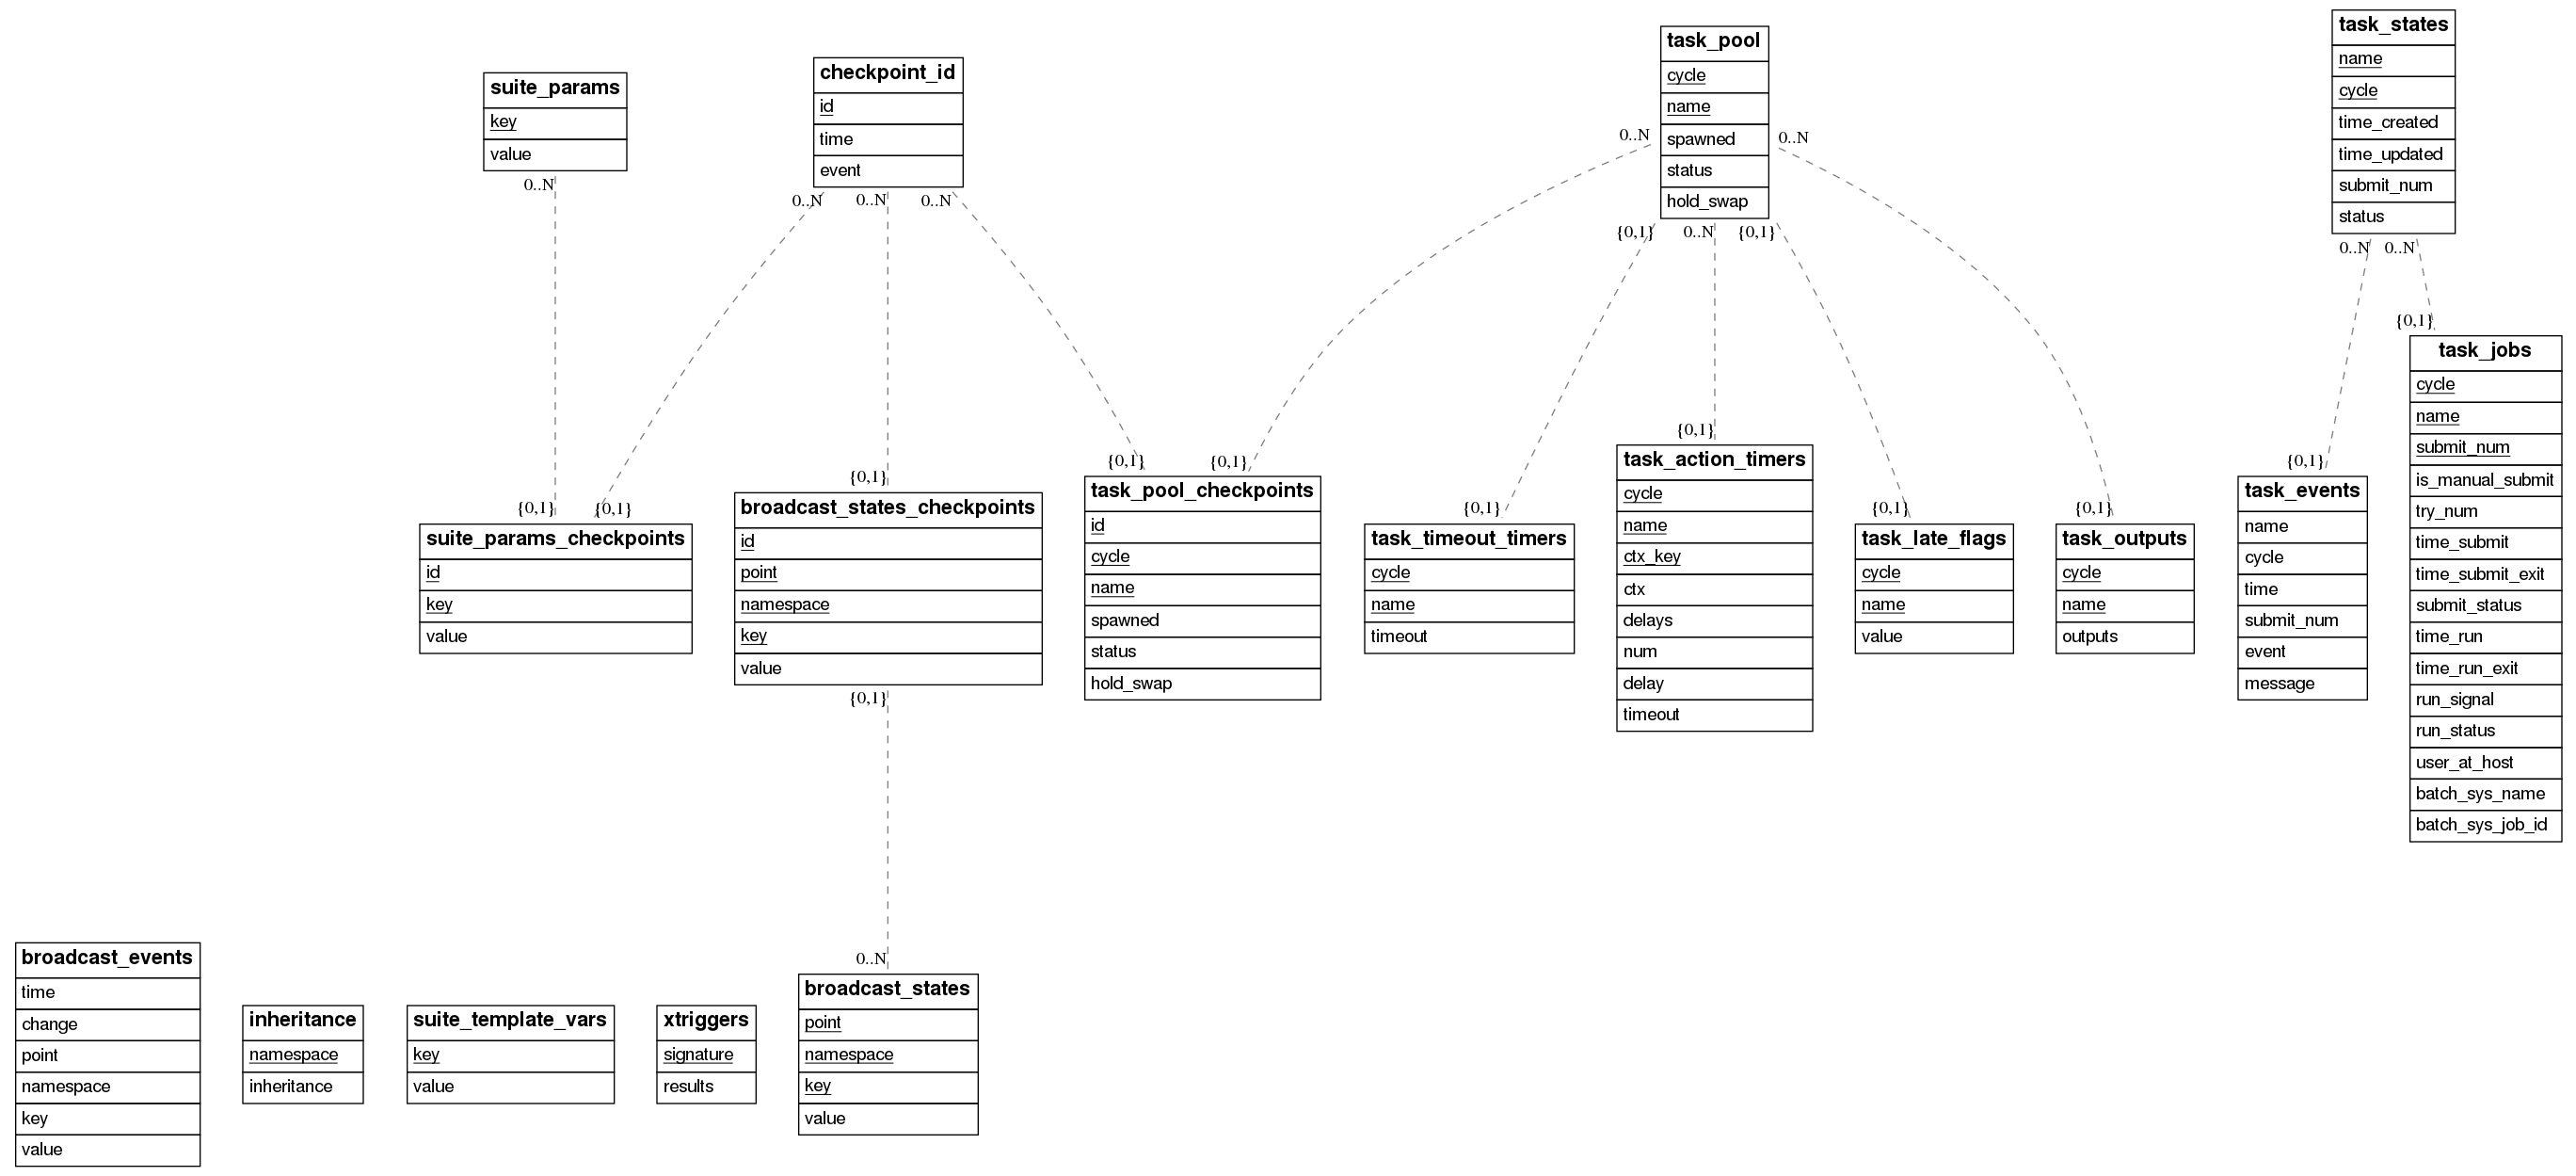
After fiddling with the graph syntax, and finding an example with a subgraph, I was able to organize the tables in a way that seemed easier for other developers and users to read and understand it.
# file: final.dot
graph {
	node [label = "\N", shape = plaintext];
	edge [color = gray50, minlen = 2, style = dashed];
	rankdir = "TB";
	newrank="true"

	subgraph orphan {rank = sink
		"broadcast_events" [label=<<FONT FACE="Helvetica"><TABLE BORDER="0" CELLBORDER="1" CELLPADDING="4" CELLSPACING="0"><TR><TD><B><FONT POINT-SIZE="16">broadcast_events</FONT></B></TD></TR><TR><TD ALIGN="LEFT"><FONT>time</FONT></TD></TR><TR><TD ALIGN="LEFT"><FONT>change</FONT></TD></TR><TR><TD ALIGN="LEFT"><FONT>point</FONT></TD></TR><TR><TD ALIGN="LEFT"><FONT>namespace</FONT></TD></TR><TR><TD ALIGN="LEFT"><FONT>key</FONT></TD></TR><TR><TD ALIGN="LEFT"><FONT>value</FONT></TD></TR></TABLE></FONT>>];
		"inheritance" [label=<<FONT FACE="Helvetica"><TABLE BORDER="0" CELLBORDER="1" CELLPADDING="4" CELLSPACING="0"><TR><TD><B><FONT POINT-SIZE="16">inheritance</FONT></B></TD></TR><TR><TD ALIGN="LEFT"><u><FONT>namespace</FONT></u></TD></TR><TR><TD ALIGN="LEFT"><FONT>inheritance</FONT></TD></TR></TABLE></FONT>>];
		"suite_template_vars" [label=<<FONT FACE="Helvetica"><TABLE BORDER="0" CELLBORDER="1" CELLPADDING="4" CELLSPACING="0"><TR><TD><B><FONT POINT-SIZE="16">suite_template_vars</FONT></B></TD></TR><TR><TD ALIGN="LEFT"><u><FONT>key</FONT></u></TD></TR><TR><TD ALIGN="LEFT"><FONT>value</FONT></TD></TR></TABLE></FONT>>];
		"xtriggers" [label=<<FONT FACE="Helvetica"><TABLE BORDER="0" CELLBORDER="1" CELLPADDING="4" CELLSPACING="0"><TR><TD><B><FONT POINT-SIZE="16">xtriggers</FONT></B></TD></TR><TR><TD ALIGN="LEFT"><u><FONT>signature</FONT></u></TD></TR><TR><TD ALIGN="LEFT"><FONT>results</FONT></TD></TR></TABLE></FONT>>];
		"broadcast_states" [label=<<FONT FACE="Helvetica"><TABLE BORDER="0" CELLBORDER="1" CELLPADDING="4" CELLSPACING="0"><TR><TD><B><FONT POINT-SIZE="16">broadcast_states</FONT></B></TD></TR><TR><TD ALIGN="LEFT"><u><FONT>point</FONT></u></TD></TR><TR><TD ALIGN="LEFT"><u><FONT>namespace</FONT></u></TD></TR><TR><TD ALIGN="LEFT"><u><FONT>key</FONT></u></TD></TR><TR><TD ALIGN="LEFT"><FONT>value</FONT></TD></TR></TABLE></FONT>>];
	}
	"broadcast_states_checkpoints" [label=<<FONT FACE="Helvetica"><TABLE BORDER="0" CELLBORDER="1" CELLPADDING="4" CELLSPACING="0"><TR><TD><B><FONT POINT-SIZE="16">broadcast_states_checkpoints</FONT></B></TD></TR><TR><TD ALIGN="LEFT"><u><FONT>id</FONT></u></TD></TR><TR><TD ALIGN="LEFT"><u><FONT>point</FONT></u></TD></TR><TR><TD ALIGN="LEFT"><u><FONT>namespace</FONT></u></TD></TR><TR><TD ALIGN="LEFT"><u><FONT>key</FONT></u></TD></TR><TR><TD ALIGN="LEFT"><FONT>value</FONT></TD></TR></TABLE></FONT>>];
	...
	"task_timeout_timers" [label=<<FONT FACE="Helvetica"><TABLE BORDER="0" CELLBORDER="1" CELLPADDING="4" CELLSPACING="0"><TR><TD><B><FONT POINT-SIZE="16">task_timeout_timers</FONT></B></TD></TR><TR><TD ALIGN="LEFT"><u><FONT>cycle</FONT></u></TD></TR><TR><TD ALIGN="LEFT"><u><FONT>name</FONT></u></TD></TR><TR><TD ALIGN="LEFT"><FONT>timeout</FONT></TD></TR></TABLE></FONT>>];
	"task_states" -- "task_events" [taillabel=<<FONT>0..N</FONT>>,headlabel=<<FONT>{0,1}</FONT>>];
	...
	"task_pool" -- "task_timeout_timers" [taillabel=<<FONT>{0,1}</FONT>>,headlabel=<<FONT>{0,1}</FONT>>];
}
And that way you can generate your database diagram during your build process, and include in your project documentation. Here’s the final script.
And an issue created asking to allow more customization for cases like this one.
Categories: Blog
Tags: Python, Cylc, Database, Sqlite, Workflows, Programming